

April 5, 2022 | Jonathan Bird
We can’t see what the future will bring—but we can learn from the past. One of my favorite websites is www.portfoliovisualizer. com. It provides a back-testing tool that lets you see how actual portfolios—and actual withdrawal rates—would have worked over any date range beginning as far back as 1985. I want to show you a purely hypothetical example for illustrative purposes only. If you retired then, at sixty-five, and utilized the income-on-demand strategy, where would you stand in 2019, at age ninety-nine? On the other side of a dot-com bust and the Great Recession?
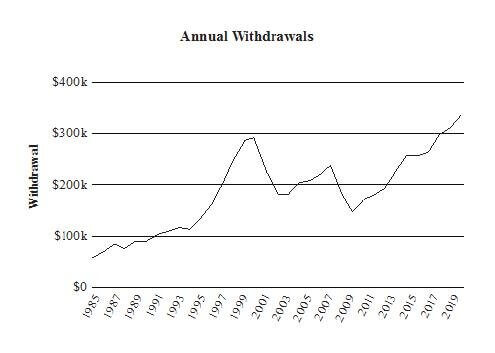
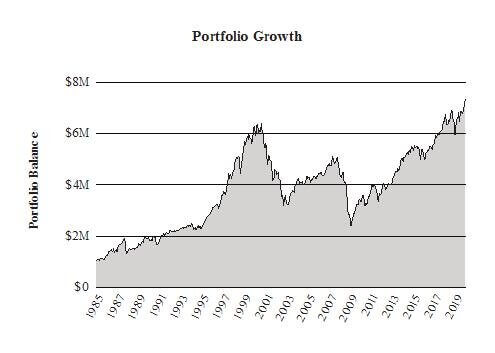
We start with some assumptions. Let’s say the beginning portfolio balance is $1 million, invested entirely in Vanguard’s S&P 500 index fund. Let’s say you wanted income worth 5 percent of the portfolio’s value every year to help finance your hypothetical retirement.
The results are startling. Over those thirty-plus years, you’d have taken a total of $7,348,554 in income—and your ending portfolio balance would stand at $6,869,081. I’ll let the numbers speak for themselves in these charts.
Want to learn more about how to gain peace of mind with your investments?
Check out my book Income on Demand on Amazon to build your financial castle.
Contact Us to learn more about how Farnam Financial can help you achieve your goals.